Over the first half of 2022, the Group's traffic reached 118.2 million passengers, including 37.5 million passengers for Paris Aéroport, respectively, at 71.9% and 71.6% of the 2019 traffic level over the same period.
Based on the traffic recorded over the first half of the year, the group is revising its assumptions for 2022 as follows:
- Groupe ADP: traffic between 74 and 84% of 2019 levels (compared to 70 to 80% of 2019 previously)
- Paris Aéroport: traffic between 72 and 82% of 2019 levels (compared to 65 to 75% of 2019 previously)
The impact of these new assumptions on Groupe ADP's 2022 financial guidance will be specified in the light of the 2022 half-year results to be published on Thursday 28 July after the market close.
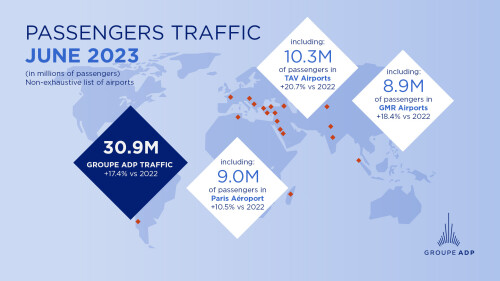
Groupe ADP [1] total traffic is up by +15.9 million passengers in June 2022 compared to June 2021, with 26.3 million passengers welcomed for the entire network of operated airports. It stands at 81,8% of the June 2019 group traffic.
Since the beginning of the year, Groupe ADP total traffic is up by +134.4% compared to 2021, at 118.2 million passengers, standing at 71.9% of the group traffic over the same period in 2019.
Unless otherwise indicated, the following changes are expressed in comparison with June 2021.
Regarding the Paris Aéroport:
June 2022 traffic is up by +5.3 million passengers, with 8.1 million passengers welcomed. It stands at 82.1% of the June 2019 Paris Aéroport traffic.
In June 2022, Paris‑Charles de Gaulle welcomed 5.5 million passengers (+3.8 million passengers), at 78.8% of the June 2019 traffic, and Paris-Orly 2.7 million passengers (+1.5 million passengers), at 89.6% of the June 2019 traffic.
Since the beginning of the year, traffic in Paris Aéroport is up by +26.7 million passengers compared to the 1st semester of 2021, at 37.5 million passengers, at 71.6% of the traffic over the same period in 2019.
At Paris-Charles de Gaulle, all terminals are currently open to passenger traffic except Terminal 1. At Paris-Orly, all sectors are open.
In June 2022:
- International traffic (excluding Europe, including French Overseas Territories) was up compared to 2022 +2.0million passengers, at 77.0% of the June 2019 traffic. All the destinations are growing: North America +785,629 passengers, at 81.2%of the June 2019 traffic, Asia-Pacific +153,320 passengers, at 33.1% of the June 2019 traffic, Latin America +153,967 passengers, at 74.3% of the June 2019 traffic, the Middle East +264,998 passengers, at 84.0% of the June 2019 traffic, Africa +527,237 passengers, at 90.9% of the June 2019 traffic;
- European traffic (excluding France) was up +2.8 million passengers, at 87.1%of the June 2019 traffic;
- Traffic within mainland France was up +504 491 passengers, at 80.3%of the June 2019 traffic.
- Traffic with the French Overseas Territories (included within the international traffic) was up +115,734 passengers, at 89.0%of the June 2019 traffic.
- The number of connecting passengers stood at 804,019, up by +479,511 passengers, at 77.1%of the June 2019 traffic. The connecting rate stood at 19,6%down by -2.3 points.
In the context created by Russia's invasion of Ukraine and the international sanctions imposed on Russia, the group is monitoring the situation to assess its short, medium and long-term consequences. In 2019, traffic with Ukraine and Russia amounted to 1.4% of Paris Aéroport's total traffic, as well as to 17.1% [2] of TAV Airports' total traffic, at 27.9% [2] of TAV Airports' international traffic.
At this stage, although air traffic between Russia and Ukraine, and the airports operated by Groupe ADP located within the European Union (to and from) is heavily impacted, the Group does not anticipate, in the absence of any significant change in the situation, that the consequences of the conflict will challenge its financial forecasts and traffic hypotheses for 2022 full year.
Regarding Groupe ADP's international platforms:
Passenger traffic at TAV Airports, 46.4 %-owned by Groupe ADP, is up by +3.9 million passengers in June 2022, at 8.5 million passengers, standing at 80.2% of the June 2019 traffic. It is up by +102.6% since the beginning of the year compared to the same period in 2021, at 72.8% of traffic over the same period in 2019.
Passenger traffic at GMR Airports, 49%-owned by Groupe ADP since July 2020, was up by +5.3 million passengers in June 2022, at 7.3 million passengers, standing at 86.7% of the June 2019 traffic. It is up by +88.8% since the beginning of the year compared to the same period in 2021, at 76.2% of traffic over the same period in 2019.
Passenger traffic at Amman Airport, 51%-owned by Groupe ADP, was up by +322,662 passengers in June 2022, at 711,983 passengers, standing at 85.1% of the June 2019 traffic. It is up by +2.0 million passengers since the beginning of the year compared to the same period in 2021, at 78.3% of traffic over the same period in 2019.
Passenger traffic at Santiago de Chile Airport, 45%-owned by Groupe ADP, was up by +829,413 passengers in June 2022, at 1.3 million passengers, standing at 74.3% of the June 2019 traffic. It is up by +5.4 million passengers since the beginning of the year compared to the same period in 2021, at 69.2% of traffic over the same period in 2019.
All the Group's hubs are open to commercial flights. However, local restrictions may apply, particularly to international flights at Group airports.
[1] Group traffic is accounted for on a like-for-like basis, restated for the following changes: the acquisitions of Delhi, Hyderbad, Mactan Cebu and Almaty airports, and the non-renewal of the technical assistance contract (TSA) for Mauritius airport.
[2] Including Almaty and Zagreb airports.
|
Passengers |
June 2022 |
Change 22/21 |
Jan. - June 2022 |
% change 2022/2021 |
Last 12 months |
% change 2022/2021 |
|
Paris-CDG |
5,450,028 |
+3,762,599 |
24,839,405 |
+275.3% |
44,417,110 |
+199.6% |
|
Paris-Orly |
2,697,825 |
+1,523,945 |
12,613,395 |
+207.1% |
24,230,380 |
+163.9% |
|
Total Paris Aéroport |
8,147,853 |
+5,286,544 |
37,452,800 |
+249.2% |
68,647,490 |
+185.9% |
|
Santiago de Chile |
1,334,065 |
+829,413 |
8,710,432 |
+161.4% |
15,391,052 |
+181.0% |
|
Amman |
711,983 |
+322,662 |
3,248,467 |
+163.4% |
6,574,319 |
+281.2% |
|
New Delhi |
5,126,045 |
+3,619,388 |
27,191,467 |
+83.4% |
49,504,737 |
+87.0% |
|
Hyderabad |
1,646,282 |
+1,220,577 |
8,747,445 |
+80.2% |
15,883,143 |
+71.7% |
|
Cebu |
511,524 |
+414,588 |
2,115,086 |
+348.2% |
2,960,077 |
+298.8% |
|
Total GMR Airports |
7,283,851 |
+5,254,553 |
38,053,998 |
+88.8% |
68,347,957 |
+87.4% |
|
Antalya |
3,911,395 |
+2,180,540 |
10,219,631 |
+143.3% |
28,027,469 |
+145.2% |
|
Almaty |
684,779 |
+120,838 |
3,053,271 |
+11.8% |
6,425,288 |
+34.8% |
|
Ankara |
732,986 |
+114,934 |
3,905,235 |
+62.3% |
8,513,446 |
+78.4% |
|
Izmir |
1,002,634 |
+320,387 |
4,238,547 |
+69.8% |
9,413,308 |
+70.7% |
|
Bodrum |
550,111 |
+193,283 |
1,294,521 |
+86.8% |
3,521,493 |
+85.3% |
|
Gazipaşa Alanya |
82,324 |
+35,046 |
299,421 |
+108.1% |
763,578 |
+133.9% |
|
Medina |
505,661 |
+389,233 |
2,765,710 |
+326.0% |
3,874,403 |
+236.0% |
|
Tunisia |
175,823 |
+109,864 |
461,508 |
+258.0% |
856,860 |
+159.2% |
|
Georgia |
310,406 |
+98,871 |
1,378,076 |
+147.2% |
3,011,960 |
+355.5% |
|
North Macedonia |
236,557 |
+122,410 |
948,815 |
+140.7% |
1,945,969 |
+161.5% |
|
Zagreb (1) |
292,761 |
+191,828 |
1,299,234 |
+285.1% |
2,366,340 |
+231.2% |
|
Total TAV Airports |
8,485,437 |
+3,877,234 |
29,863,969 |
+102.6% |
68,720,139 |
+112.7% |
|
Other Airports |
351,249 |
+301,421 |
907,372 |
+237.8% |
1,265,502 |
+181.2% |
|
Total Groupe ADP (2) |
26,314,438 |
+15,876,983 |
118,237,038 |
+134.4% |
228,946,459 |
+127.9% |
|
Aircraft Movements |
June 2022 |
Change 22/20 |
Jan. - June 2022 |
% change 2022/2021 |
Last 12 months |
% change 2022/2021 |
|
Paris-CDG |
36,724 |
+18,353 |
184,108 |
+114.0% |
348,170 |
+88.2% |
|
Paris-Orly |
17,734 |
+8,296 |
88,543 |
+143.5 % |
170,736 |
+120.0% |
|
Total Paris Aéroport |
54,458 |
+26,649 |
272,651 |
+122.7% |
518,906 |
+97.6% |
|
Santiago de Chile |
9,043 |
+4,446 |
60,472 |
+104.9% |
108,720 |
+118.7% |
|
Amman |
6,211 |
+2,262 |
31,547 |
+107.4% |
62,940 |
+172.0% |
|
New Delhi |
34,322 |
+20,695 |
185,800 |
+47.0% |
348,696 |
+53.4% |
|
Hyderabad |
12,801 |
+7,978 |
69,335 |
+41.3% |
130,380 |
+37.9% |
|
Cebu |
4,487 |
+3,358 |
19,022 |
+227.3% |
27,463 |
+196.5% |
|
Total GMR Airports |
51,610 |
+32,031 |
274,157 |
+51.3% |
506,539 |
+53.0% |
|
Antalya |
22,835 |
+12,018 |
65,685 |
+136.4% |
166,462 |
+137.2% |
|
Almaty |
6,226 |
+1,329 |
29,103 |
+14.3% |
60,513 |
+25.4% |
|
Ankara |
5,304 |
+617 |
28,885 |
+46.0% |
64,509 |
+62.8% |
|
Izmir |
6,493 |
+1,857 |
27,852 |
+53.5% |
61,283 |
+48.4% |
|
Bodrum |
3,697 |
+1,162 |
9,091 |
+74.8% |
24,155 |
+76.5% |
|
Gazipaşa Alanya |
568 |
+157 |
2,213 |
+69.6% |
5,669 |
+101.4% |
|
Medina |
4,353 |
+2,925 |
22,957 |
+173.2% |
34,367 |
+145.8% |
|
Tunisia |
1,268 |
+746 |
3,710 |
+160.9% |
7,103 |
+92.5% |
|
Georgia |
2,944 |
+200 |
14,850 |
+71.4% |
33,006 |
+149.7% |
|
North Macedonia |
2,091 |
+629 |
8,367 |
+51.5% |
17,831 |
+70.7% |
|
Zagreb(1) |
3,763 |
+1,337 |
19,586 |
+83.8% |
38,533 |
+77.9% |
|
Total TAV Airports |
59,542 |
+22,977 |
232,299 |
+75.5% |
513,431 |
+84.1% |
|
Other Airports |
2,362 |
+1,361 |
9,282 |
+59,3% |
15,247 |
+52,5% |
|
Total Groupe ADP (2) |
183,226 |
+89,726 |
880,408 |
+80,9% |
1,725,783 |
+80,6% |
(1) Groupe ADP and TAV Airports have, a shareholding of 21% and 15%, respectively, in Zagreb Airport. To be compliant with TAV Airports presentations, Zagreb Airport traffic figures are integrated into the TAV Airports group traffic figure.
(2) Group traffic is accounted for on a like-for-like basis, restated for the following changes: the acquisitions of Delhi, Hyderabad, Mactan Cebu and Almaty airports, and the non-renewal of the technical assistance contract (TSA) for Mauritius airport. For the last 12-months traffic, Mauritius traffic is not taken into account. If Mauritius traffic was taken into account until December 31st, 2021, last 12-months traffic for Groupe ADP would be up by +128.0%.
|
Geographic split Paris Aéroport |
June 2022 |
Share of total traffic |
Jan. ‑ June 2022 change 22/21 |
Share of total traffic |
|
France |
+69.2% |
15.1% |
+3,140,019 |
15.8% |
|
Europe |
+244.7% |
48.1% |
+13,343,772 |
45.6% |
|
Other International Of which |
+200.9% |
36.8% |
+10,242,544 |
38.6% |
|
Africa |
+135.9% |
11.2% |
+2,784,246 |
11.8% |
|
North America |
+385.5% |
12.1% |
+3,312,813 |
10.5% |
|
Latin America |
+335.5% |
2.5% |
+962,952 |
3.4% |
|
Middle-East |
+221.2% |
4.7% |
+1,446,640 |
5.3% |
|
Asia-Pacific |
+376.3% |
2.4% |
+539,324 |
2.0% |
|
French Overseas Territories |
+58.5% |
3.8% |
+1,196,569 |
5.7% |
|
Total Paris Aéroport |
+184.8% |
100.0% |
+17,680,011 |
100.0% |
|
Paris Aéroport |
May 2022 |
Change 2022/2021 |
Jan. – May 2022 |
% change 2022/2021 |
|
Connecting Passengers(1) |
804,019 |
+147.8% |
3,979,458 |
+172.9% |
|
Connecting rate |
19.6% |
-2.3 pts |
21.4% |
-6.1 pts |
|
Seat load factor |
85.8% |
+19.6 pts |
78.4% |
+19.8 pts |
(1) Departing passengers