In March 2018, Paris Aéroport welcomed 8.3 million passengers, an increase of 5.5% compared with March 2017. 5.6 million passengers travelled through Paris-Charles de Gaulle (+6.1%) and 2.6 million through Paris-Orly (+4.1%).
- International traffic (excluding Europe) was up (+9.7%), due to growth in the following destinations: the Middle East (+15.3%), Africa (+12.1%), North America (+11.7%), the French Overseas Territories (+9.6%), Asia-Pacific (+4.0%). Only Latin America was down slightly (-0.1%);
- European traffic (excluding France) was up by 5.2%;
- Traffic within France was down by 3.6%;
- The number of connecting passengers increased by 1.1%. The connecting rate stood at 23.2%, down by 0.2 points compared with March 2017.
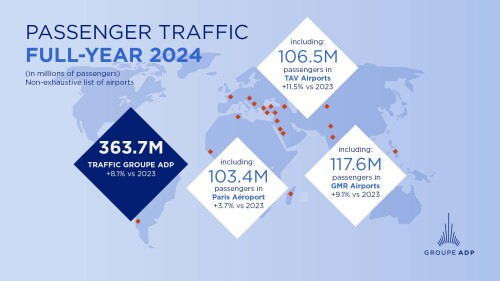
Since the beginning of the year, Paris Aéroport passenger traffic has increased by 3.7%, with a total of 22.8 million passengers. The number of connecting passengers has risen by 2.1%. The connecting rate stands at 23.9%, down by 0.3 points.
Passenger traffic at TAV Airports, 46.1%-owned by Groupe ADP, increased by 20.7% in March 2018 and by 23.4% since the beginning of the year.
Passenger traffic at Santiago de Chile Airport, 45%-owned by Groupe ADP, increased by 11.5% in March 2018 and by 14.0% since the beginning of the year.
Passenger traffic at TAV Airports, 46.1%-owned by Groupe ADP, increased by 20.7% in March 2018 and by 23.4% since the beginning of the year.
Passenger traffic at Santiago de Chile Airport, 45%-owned by Groupe ADP, increased by 11.5% in March 2018 and by 14.0% since the beginning of the year.
| Passengers |
March 2018 |
% change 2018/2017 | Jan.- Mar. 2018 |
% change 2018/2017 | Last 12 months |
% change 2018/2017 |
| Paris-CDG | 5,626,025 | +6.1% | 15,588,352 | +4.6% | 70,159,985 | +5.4% |
| Paris-Orly | 2,640,900 | +4.1% | 7,213,123 | +1.8% | 32,173,095 | +1.6% |
| Total Paris Aéroport | 8,266,925 | +5.5% | 22,801,475 | +3.7% | 102,333,080 | +4.2% |
| Santiago | 1,920,344 | +11.5% | 6,297,534 | +14.0% | 22,200,151 | +12.8% |
| Istanbul Atatürk | 5,556,701 | +17.5% | 15,538,831 | +21.5% | 66,478,069 | +12.0% |
| Ankara Esenboga | 1,511,576 | +37.2% | 4,435,137 | +41.4% | 17,143,909 | +29.7% |
| Izmir | 1,082,089 | +15.1% | 3,093,933 | +16.1% | 13,252,601 | +10.2% |
| Milas Bodrum | 125,629 | +24.1% | 330,468 | +24.6% | 3,574,584 | +10.6% |
| Gazipaşa | 40,493 | +32.8% | 104,873 | +29.4% | 847,074 | +18.1% |
| Medinah | 749,818 | +16.3% | 2,088,466 | +14.7% | 8,073,081 | +19.7% |
| Tunisia | 63,390 | +53.4% | 153,845 | +29.6% | 1,718,706 | +10.4% |
| Georgia | 308,655 | +36.8% | 757,506 | +37.5% | 3,861,014 | +42.1% |
| Macedonia | 162,600 | +24.1% | 448,729 | +21.5% | 2,106,896 | +15.8% |
| Zagreb(1) | 223,642 | +16.2% | 585,576 | +13.5% | 3,161,623 | +14.0% |
| Total TAV Airports | 9,824,593 | +20.7% | 27,537,364 | +23.4% | 120,217,557 | +15.4% |
(1) Groupe ADP and TAV Airports have, a shareholding of 21% and 15%, respectively, in Zagreb Airport. To be compliant with TAV Airports presentations, Zagreb Airport traffic figures are integrated into the TAV Airports group traffic figures.
| Aircraft Movements | March 2018 | % change 2018/2017 | Jan.- Mar. 2018 | % change 2018/2017 | Last 12 months | % change 2018/2017 |
| Paris-CDG | 38,053 | +0.1% | 107,852 | +0.4% | 476,052 | +0.5% |
| Paris-Orly | 18,175 | -1.9% | 50,776 | -2.7% | 227,602 | -3.0% |
| Total Paris Aéroport | 56,228 | -0.5% | 158,628 | -0.6% | 703,654 | -0.6% |
| Santiago | 12,709 | +12.3% | 40,381 | +14.8% | 145,685 | +13.4% |
| Istanbul Atatürk | 37,432 | +5.5% | 106,701 | +9.2% | 458,458 | +4.3% |
| Ankara Esenboga | 10,032 | +27.4% | 29,207 | +28.3% | 113,195 | +19.9% |
| Izmir | 6,344 | +2.9% | 18,817 | +6.1% | 83,941 | +6.1% |
| Milas Bodrum | 883 | +29.9% | 2,209 | +24.6% | 23,696 | +3.6% |
| Gazipaşa | 304 | +34.5% | 769 | +28.0% | 5,830 | +10.5% |
| Medinah | 5,213 | +16.9% | 14,973 | +16.7% | 60,189 | +11.4% |
| Tunisia | 528 | -4.3% | 1,421 | -11.4% | 11,829 | -4.1% |
| Georgia | 3,190 | +30.1% | 8,006 | +26.2% | 39,568 | +34.8% |
| Macedonia | 1,430 | +19.7% | 4,018 | +18.8% | 18,765 | +11.7% |
| Zagreb | 3,143 | 0.0% | 8,874 | +4.3% | 41,947 | +3.8% |
| Total TAV Airports | 68,499 | +10.0% | 194,995 | +12.6% | 857,418 | +8.0% |
| Geographic split Paris Aéroport (Paris-CDG and Paris-Orly) |
Mar. 2018 % change 2018/2017 |
Share of total traffic | Jan.- Mar. 2018 % change 2018/2017 |
Share of total traffic |
| France | -3.6% | 15.7% | -3.4% | 15.8% |
| Europe | +5.2% | 42.7% | +4.1% | 41.9% |
| Other International Of which |
+9.7% | 41.6% | +6.3% | 42.3% |
| Africa | +12.1% | 11.9% | +8.1% | 12.1% |
| North America | +11.7% | 9.1% | +6.8% | 8.5% |
| Latin America | -0.1% | 3.4% | -1.4% | 3.7% |
| Middle-East | +15.3% | 5.7% | +9.7% | 5.7% |
| Asia-Pacific | +4.0% | 6.8% | +2.1% | 7.0% |
| French Overseas Territories | +9.6% | 4.8% | +9.7% | 5.2% |
| Total Paris Aéroport | +5.5% | 100 % | +3.7% | 100 % |
| Paris Aéroport (Paris-CDG and Paris-Orly) |
Mar. 2018 | % change 2018/2017 | Jan.- Mar. 2018 | % change 2018/2017 |
| Connecting passengers(1) | 925,578 | +1.1% | 2,711,820 | +2.1% |
| Connecting rate | 23.2% | -0.2 pt | 23.9% | -0.3 pt |
| Seat load factor | 85.6% | +3.2 pt | 83.7% | +2.1 pt |